How many zeros are there in 2^n?
Posted by: Gary Ernest Davis on: April 23, 2011
An old problem asks if 


For instance, the next 
 |
 |
 |
 |
 |
 |
 |
 |
 |
 |
 |
 |
 |
 |
x
How many zeros?
Instead of asking the existential question “Is there a zero in the base 

Here are plots of the number of zeros in the base 


We see, progressively, what seems to be oscillations around a straight line.
What could this straight line be?
And how large are the oscillations?
A straight line model
The number of digits of 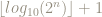


Neither the first nor last digit of 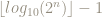
If we assume that all 

So we take as a linear model for the number of zeros in base

To get a visual feel for how this fits let’s plot the actual number of zeros along with this linear model:

The nature of the “error”
We now have a statistical model for the number of zeros, 
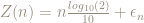
where we will refer to 
How does the error behave?
In particular, how is it distributed?
Below is a histogram of the error 

We can see the the empirical distribution of the error is “peakier” than the normal distribution, and this is borne out by the kurtosis which is 

Plotting these histograms for various values of 
Bounding the error
What we really seek is a bound on the errors sufficient to show that 
What does computation suggest?
Below is a plot of the size of the error 
It appears that 

If this does hold good then
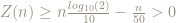
So now we have a more precise statement: prove that 

Maybe techniques of higher order Fourier analysis (Higher-Order_Fourier_Tao) could be brought to bear on this problem since they are useful in proving other equidistribution theorems? Then again, just because Weyl’s polynomial equidistribution theorem can be interpreted as a higher-order Fourier analysis application may have nothing at all to do with equidistribution of digits in
6 Responses to "How many zeros are there in 2^n?"
3 | Lawrence Kesteloot
April 24, 2011 at 3:54 pm
@Xan: “The tens digit can also never by 0.”
2^23 = 8,388,608
Did I misinterpret what you said?
Gary Ernest Davis
April 24, 2011 at 4:58 pm
I think I wrote the first and last digit, the first digit being the coefficient of 10^0.
4 | Paul Liu
April 25, 2011 at 4:08 am
You wrote Epsilon/n <= 50 above your final figure. I think you meant to write Epsilon/n <= 1/50. Otherwise, it was an interesting read.
Leave a Reply to Paul LiuCancel reply

April 24, 2011 at 1:28 pm
The tens digit can also never by 0. (You can reason it out or just look at the 2^n mod 100 cycle.) I don’t think it affects the slope of your model, but it would affect the intercept. Maybe that would make your histogram be better centered on the normal curve.