Do you understand histograms as well as a 5th grader?
Posted by: Gary Ernest Davis on: March 22, 2013
This is a joint post of Keith Resendes (histogramma.com) and Gary Davis.
Karl Pearson described histograms – and gave them their name – in 1895. As the cartoon below suggests, people still have trouble interpreting them today:
Cartoon courtesy of www.whatthegregg.com
In our experience, even university mathematics majors, studying statistics, have trouble with the meaning of histograms.
But histograms can be explained to children in elementary school.
For example, suppose the children know their height or have it measured for them in class –  let’s say in inches, as in a U.S. school, where metric hasn’t really caught on yet.
Imagine the children are enthusiastic at knowing how the heights of all the children in grades 4, 5, and 6 in the school will pan out. They go from class to class measuring and recording the heights of all these children – let’s say 200 of them.
The teacher asks them the smallest of all the recorded heights – let’s say it was 50 inches – and the largest – let’s say it was 64 inches.
The teacher asks the students what is the difference between the largest and smallest heights, and they quickly figure it to be 14 inches.
The teacher says: “Let’s divide the 14 inch difference between the largest and smallest heights into nice even and equal lots. What should we choose?”
After some argument the consensus is 2 inch lots.
“Let’s see”, says the teacher. “That would be 7 lots of 2 inches. ” She asks one of the students to collect 7 plastic containers from the storage room, and then adds: “You had better get one more.”
The teacher writes 50-51 on a piece of paper and sticky-tapes it to one of the containers.
“That’s our first bin”, she says. “I want you to look through your list of 200 heights, and every time you  see a height of 50 or 51 inches I want you to put a marble in this bin.”
One of the students goes to the store room to collect a bag of marbles.
“The next bin will have a note with 52-53 on it”, the teacher says.
“That’s for people whose height was 52 inches or 53 inches”, says one of the girls.
‘That’s right”, says the teacher. “Now can you finish labeling the bins and putting marbles in them?”
The children go through the list and finally cross off everyone on it.
The teacher draw the labels of the bins on the board like this:
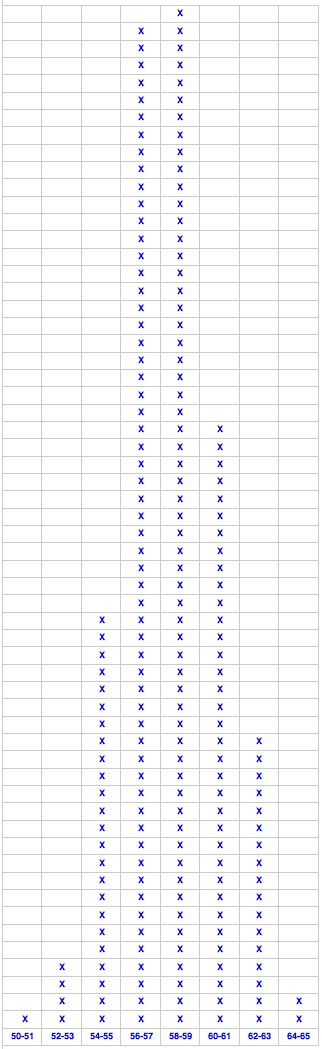
50-51 Â 52-53 Â 54-55 Â 56-57 Â 58-59 Â 60-61 Â 62-63 Â Â 64-65
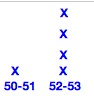
She asks the children how many marbles are in the bin labeled 50-51.  A boy looks in that bin and says there is only 1 marble. The teacher draws 1 cross above 50-51 on the board, like this:
![]()
“Now how many marbles are in the bin labelled 52-53?” she asks. The answer comes back: “Four”. The teacher draws 4 crosses above 52-53 on the board, like so:
 “Do you think you can finish this?” she asks the class. “YES”, they exclaim, and set to, to produce the following chart on the board:
“Do you think you can calculate the average height for all those 200 names on your list?†she asks.
Two of the girls work on their calculator and give her an answer of 57.985.
The teacher says she thinks that’s close enough to 58.
“This picture is called a histogram , she says. “It shows us  in a picture how the heights you recorded are spread out. What do you notice about the picture?”
The children raise their hands and sing out answers, and one of the girls says: “There are very few heights at either end. They mainly bunch up in the middle, around the average.”
“Yes they do, don’t they?” says the teacher. ” And the histogram allows us to see that very clearly, doesn’t it?”
______________________________________________________________________________________
So if grade 4 students can understand histograms why do even educated adults have problems with their interpretation? Is it because we’re teaching by formulas and rote procedures in college, without understanding? Have we forgotten, or never knew, the simple human roots of histograms?
2 Responses to "Do you understand histograms as well as a 5th grader?"
2 | Sue VanHattum
March 23, 2013 at 1:40 pm
I meant to say that the kids were right about the difference. Unfortunately, that’s not exactly what we need to look at. If the heights had been just 50, 51, and 52 inches, we’d get largest minus smallest = 2. But clearly there are 3 different heights. With discrete data (usually whole number choices, instead of a continuum), we always need to use largest minus smallest plus one to get the right number of items.
If heights had been measure with fractions, so the first bin was 50-52 and the next 52-54, then the last would have been 62-64. (We’d still have to figure out what to do with heights exactly at the edge, like 52.)
Leave a Reply to Sue VanHattumCancel reply

March 23, 2013 at 1:30 pm
Reading a histogram seems simple to me, but you’ve demonstrated some of the issues that can come up in creating one. The kids said the difference between largest and smallest was 14, but there are 15 different heights. (This issue is sometimes talked about in relation to fenceposts, because for 10 feet of fencing with a post every foot, you’ll need 11 fenceposts.)
When you divided 14 up into 7 equal groups, you got a group for 64-65 inches, which has an artificially small number of students in it. If you had used 5 groups, your histogram would be more accurate at the ends.