Unemployment, 2000, for U.S. metropolitan areas: a surprising distribution
Posted by: Gary Ernest Davis on: March 26, 2013
My colleague Keith Resendes (@histogramma1) is very interested in U.S. unemployment rates, utilizing data from the U.S. Bureau of Labor Statistics.
After some data munging, I got unemployment data, 2000-2013, by metropolitan area,  from the Bureau of Labor Statistics website into R.
From there, extracting subsets of the data is straightforward. Here is the histogram – over U.S. metropolitan areas – for 2000: 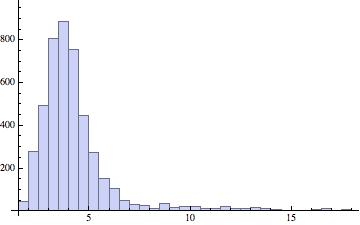 and here are the basic descriptive statistics:
Mean = 4.2
Standard deviation = 2.0
Skewness = 3.1
Kurtosis = 15.9
(An astute observer will notice that these are not R-produced histograms, and they are not. I produced the histograms in Mathematica, which I like much better for this purpose.)
This is a highly skewed (skewness = 3.1)Â and very peaky (15.9) distribution. By way of comparison a normal distribution has skewness 0 and kurtosis 3.
So, relying on experience and a guess, I transformed the data by taking logs. Here is the resulting histogram and descriptive statistics:   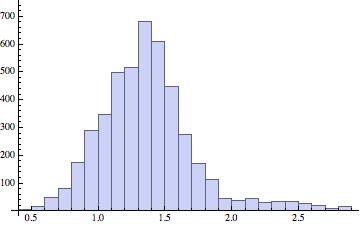
Mean = 1.4
Standard deviation = 0.4
Skewness = 1.1
Kurtosis = 5.4
Still we see that the log-transformed data is skewed and very peaky. So, on the principle that when you’re on a good thing stick to it, I transformed the data by once again taking logs. That is, the data entries are now the log of the log of the original unemployment rates. Here’s the histogram and descriptive statistics that result: 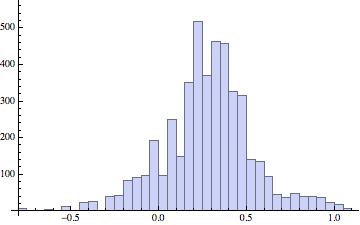
Mean = 0.28
Standard deviation = 0.26
Skewness = -0.09
Kurtosis = 4.04
This is an almost symmetric distribution (skewness = -0.09) but it is still a little peakier than a normal distribution (kurtosis = 4.04 compared with 3 for a normal distribution). So I am guessing that the log-log transformed data might be well-fitted by a normal-inverse Gaussian distribution.
I have never before seen naturally occurring data that might reasonably be  described as log-log normal-inverse Gaussian.
I am wondering what the distributions for the years 2001-2013 will produce.

Leave a Reply