Apparent puzzles with goodness-of-fit tests
Posted by: Gary Ernest Davis on: November 9, 2013
Given two data sets it is a not unreasonable question to ask if they have similar distributions.
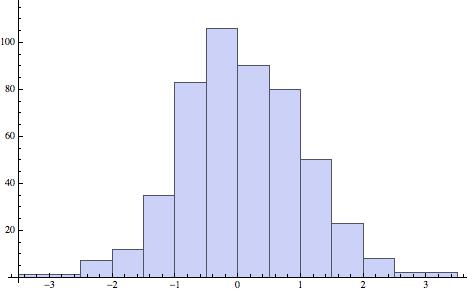
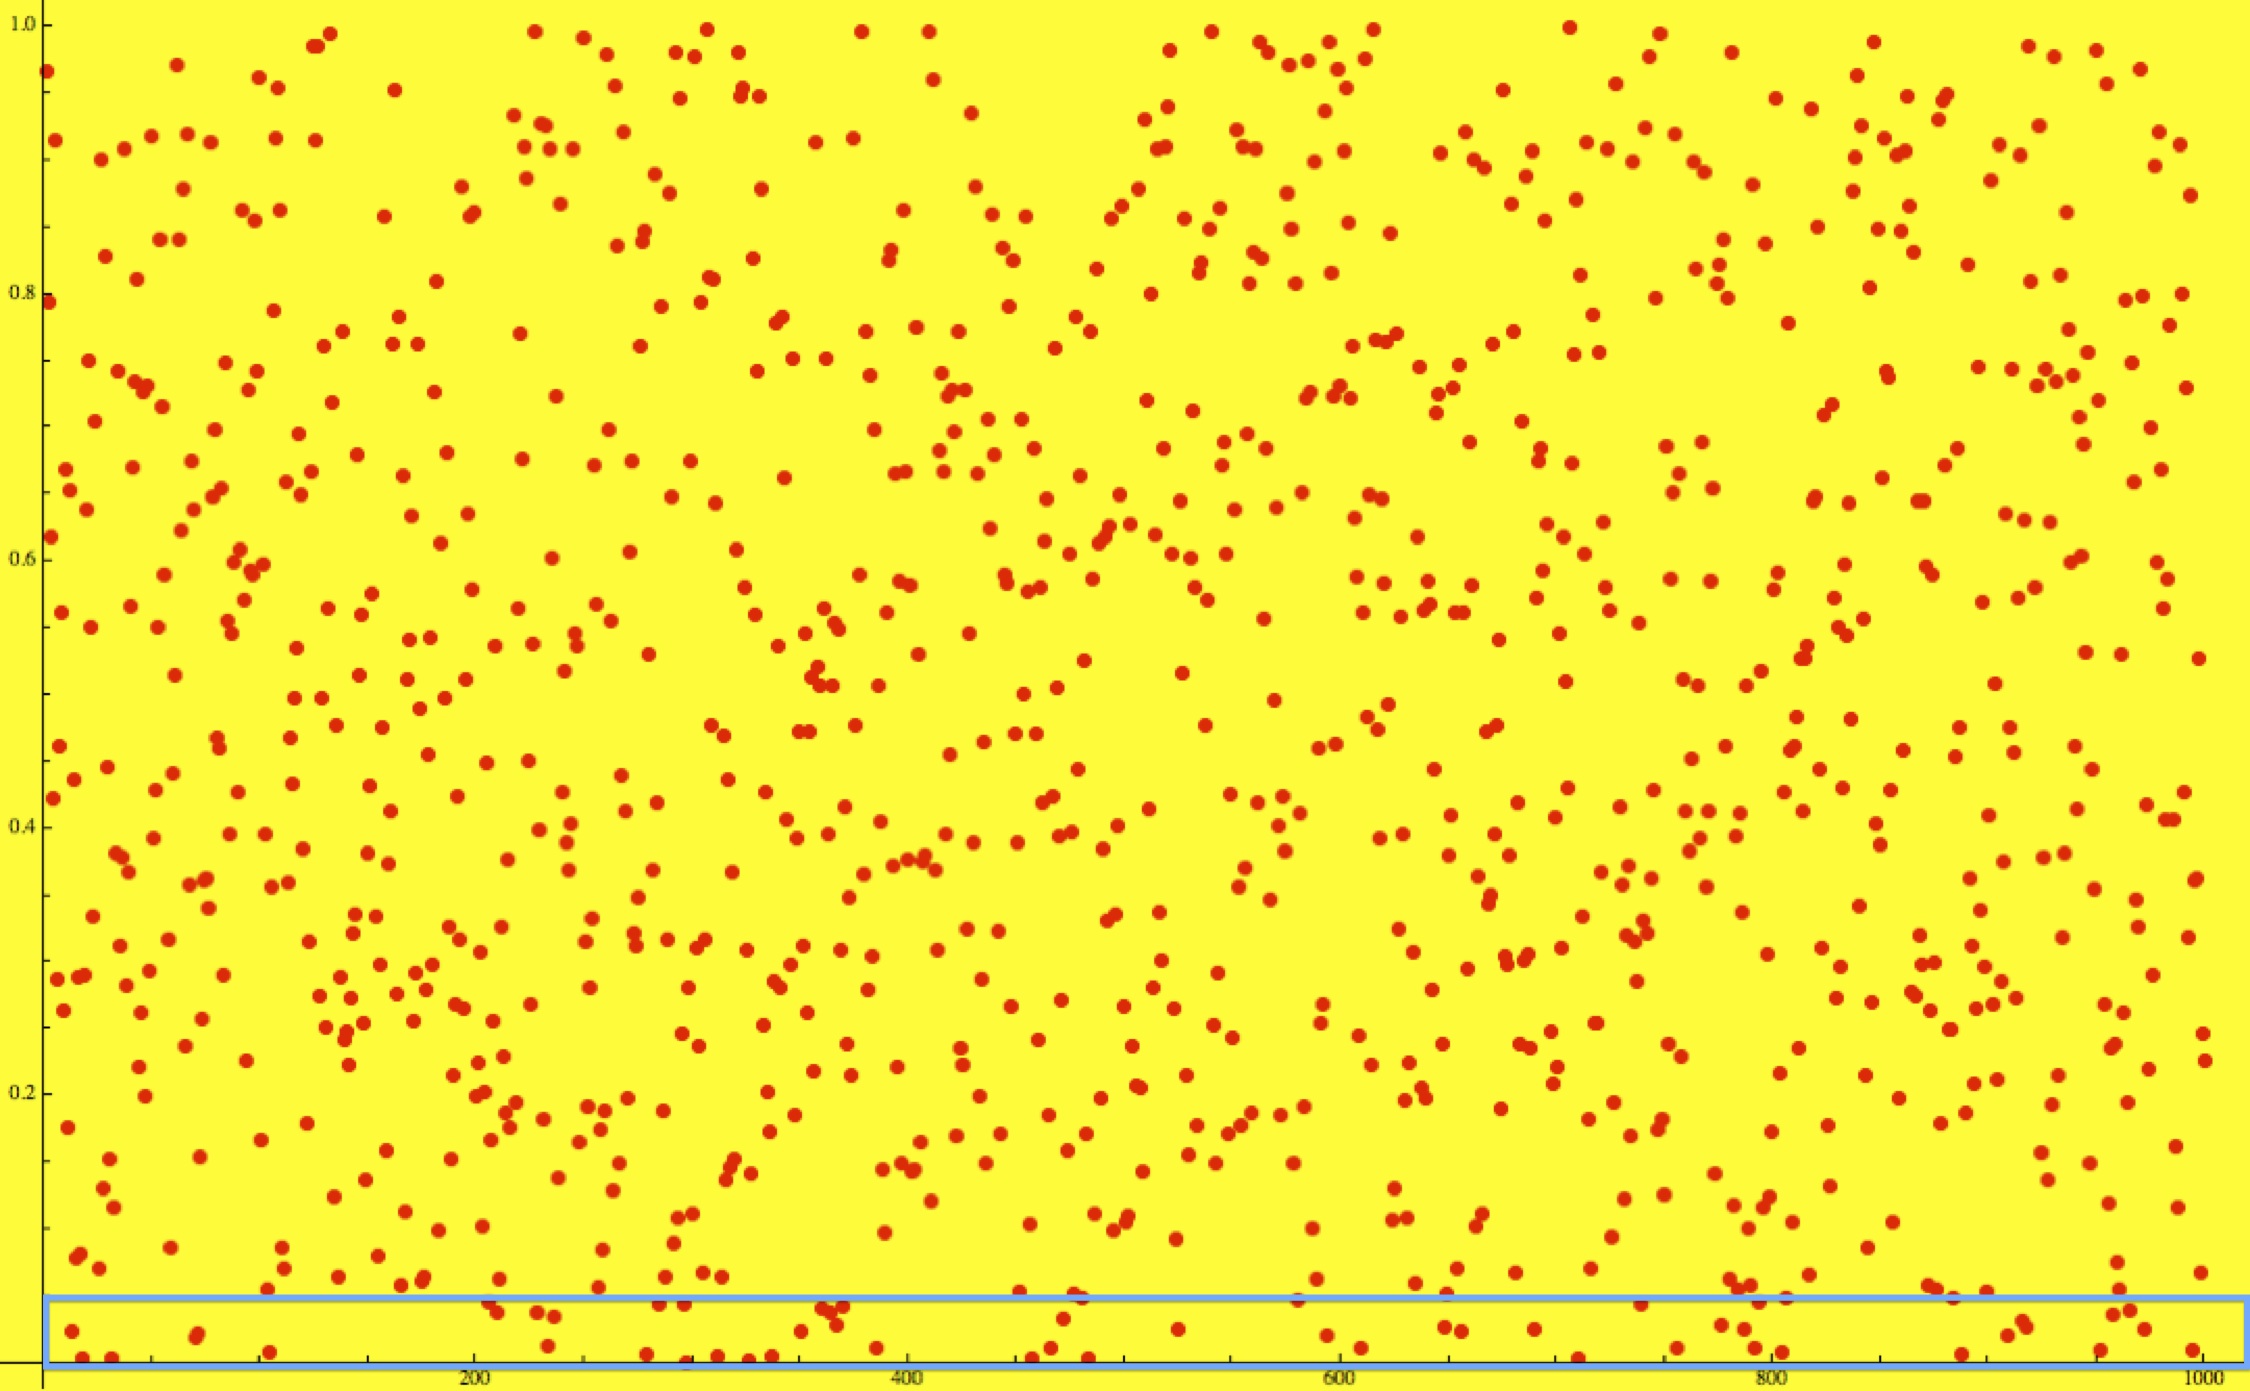
For example, if we produce one data set of 500 numbers between 0 and 1, chosen uniformly and randomly (at least as randomly as we can using a pseudo-random number generator), and another data set of 500 numbers distributed normally, with mean 0 and variance 1, then eyeballing their histograms tells us , even if we did not know, that they are not similarly distributed:
A more considered way of approaching the question of whether two data sets are similarly distributed is to utilize one or more goodness of fit tests. There are several of these in common use, including:
Mathematica® incorporates these, and other goodness-of-fit tests in the function DistributionFitTest[]
These goodness-of-fit tests basically perform a hypothesis test with the null hypothesis 

The goodness-of-fit tests return a p-value, and a small p-value indicates it is unlikely the data sets are similarly distributed.
So, if we carry out the Pearson Chi-Square test on the uniform and normal data sets, as above, we get the exceptionally small p-value 
The p-value from a Pearson Chi-Square test is a random variable: if we carry out the test on two other data sets, one from a uniform distribution, the other from a normal distribution, we will get a somewhat different p-value. How different? The plot below shows the variation in p-values when we simulated choosing 500 uniformly distributed numbers and 500 normally distributed numbers 1,000 times:
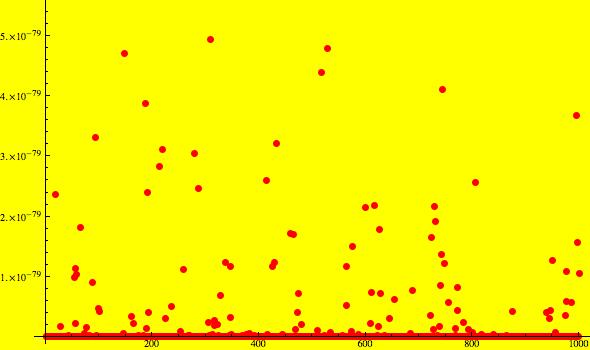
We see that despite some variation the values are all very small, as we would expect.
Now let’s see what happens if we choose  500 points from a uniform distribution, and 500 more points from the same uniform distribution. We expect the Pearson Chi-Square test to return a reasonably high p-value, indicating that we cannot reject the idea that the data come from the same distribution.  We did this once and got a satisfying 0.741581 as the p-value.
But what if we repeat this experiment 1,000 times. How will the p-values vary?
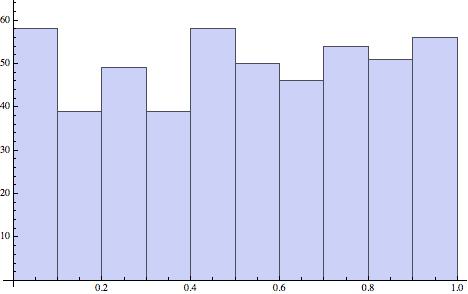
The plot below shows the result of 1,000 simulations of choosing two data sets of 500 points, each from the same uniformly distribution:
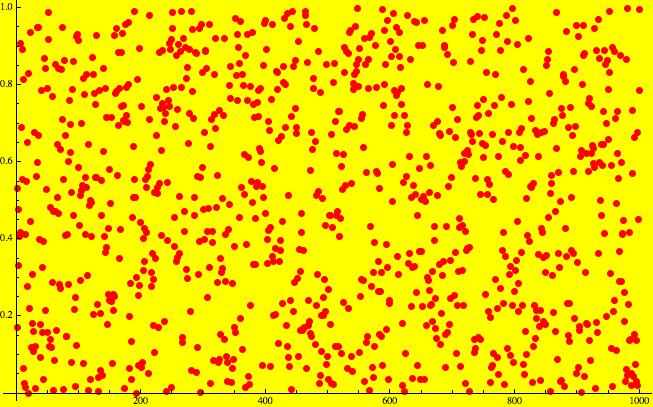
These p-values seem reasonably uniformly spread between 0 and 1. Are they? The Cramér-von Mises goodness-of-fit test indicates that we cannot reject the hypothesis that these p-values are uniformly distributed in the interval [0,1].
We set the confidence level for the Pearson Chi-Square test at 0.01, so we could expect that 1 time in 100 the Pearson Chi-Square test will indicate that the two data sets are not from the same distribution, even though they are. In 1,000 trials we could expect about 10 such instances, and that is more or less what we find.
The uniform distribution of the p-values is, at first glance, quite surprising, but since the p-values themselves are random values we expect that they will indicate something other than what we know to be the case every so often, dependent on the confidence level we set beforehand. For example, with the confidence level set at 0.05, we see that about 5% of the time the Pearson Chi-Square test indicates that the two data sets are not from the same distribution even though they are. :
Notes:
- We randomly reset the seed for the pseudo-random number generator in Mathematica® at each of the 1,000 simulations.
- The result of uniformly distributed p-values for data sets from the same distribution  is not peculiar to the Pearson Chi-Square test.
- The uniform distribution of p-values under the null hypothesis is proved here.

Leave a Reply